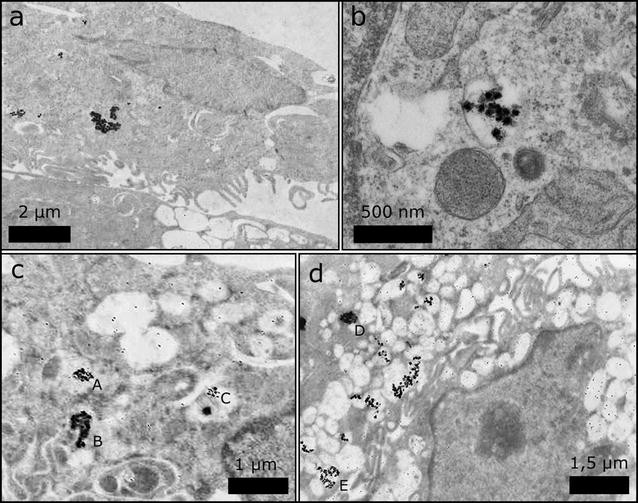
Fig. 6

TEM images of slices through THP-1 cells with uptaken silver NPs. In the TEM images, the silver NPs appear as dark spots in a–d. From all images it can be seen that most silver NPs are found in loosely- or densely-packed agglomerates. The larger magnification b reveals that silver NPs are located inside membrane-enclosed structures, which likely represent phagolysosomes. In c and d exemplary sizes of several agglomerates were determined. The agglomerate sizes are A = 336 nm; B = 344 nm; C = 224 nm; D = 425 nm; E = 525 nm