- Research
- Open access
- Published:
Multi-omics analysis of Au@Pt nanozyme for the modulation of glucose and lipid metabolism
Journal of Nanobiotechnology volume 22, Article number: 524 (2024)
Abstract
Au@Pt nanozyme, a bimetallic core–shell structure Au and Pt nanoparticle, has attracted significant attention due to its excellent catalytic activity and stability. Here, we propose that Au@Pt improves glucose tolerance and reduces TG after four weeks administration. The transcriptomic analysis of mouse liver tissues treated with Au@Pt nanozyme showed changes in genes related to glucose and lipid metabolism signaling pathways, including glycolysis/gluconeogenesis, pyruvate metabolism, PPAR signaling, and insulin signaling. Moreover, analysis of fecal samples from mice treated with Au@Pt nanozyme showed significant changes in the abundance of beneficial gut microbiota such as Dubosiella, Parvibacter, Enterorhabdus, Monoglobus, Lachnospiraceae_UCG-008, Lachnospiraceae_UCG-006, Lachnospiraceae_UCG-001, and Christensenellaceae_R-7_group. Combined multi-omics correlation analyses revealed that the modulation of glucose and lipid metabolism by Au@Pt was strongly correlated with changes in hepatic gene expression profiles as well as changes in gut microbial profiles. Overall, our integrated multi-omics analysis demonstrated that Au@Pt nanozyme could modulate glucose and lipid metabolism by regulating the expression of key genes in the liver and altering the composition of gut microbiota, providing new insights into the potential applications of Au@Pt nanozyme in the treatment of metabolic disorder.
Graphical Abstract

Introduction
Globally, metabolic diseases such as diabetes and obesity have reached epidemic proportions, affecting millions of people [1, 2]. The incidence of these diseases is on the rise, and factors such as sedentary lifestyles, poor dietary choices, and genetic predisposition are contributing to the increasing burden on global healthcare systems. One of the key factors in the development of metabolic disorders is the dysregulation of glucose and lipid metabolism [3]. In diabetes, for example, the body is unable to properly regulate blood glucose levels, leading to serious complications including nerve damage, kidney failure, and cardiovascular disease [4]. Similarly, in people with obesity, an unbalanced energy intake and consumption can lead to the build-up of superfluous fat, which in turn can lead to a range of health problems, such as certain types of cancer, stroke, and heart disease [5, 6]. Given the significant impact of metabolic disorders on public health, there is an urgent need for innovative approaches to the management and treatment of these diseases. Researchers and healthcare professionals are exploring diverse strategies, including lifestyle interventions, pharmacological therapies, and surgical procedures, to modulate metabolic pathways and enhance patient outcomes [7]. However, traditional approaches to managing metabolic diseases, including drugs and lifestyle changes, have safety and efficacy limitations due to side effects and drug resistance. Innovative strategies are urgently needed to enhance disease management for individuals requiring multiple medications and long-term interventions.
Recently, nanotechnology has appeared as a field of great promise for the development of innovative therapeutic and diagnostic strategies. Among various nanomaterials, nanozymes, as a class of artificial enzymes, have attracted much attention in recent years due to their unique properties and potential applications in various fields such as biomedicine [8, 9], immunotherapy [10, 11], food safety [12, 13], and environmental applications [14, 15]. Notably, the application of nanozyme in the treatment of metabolic diseases is gradually coming into the limelight like a rising star [16]. For example, Fe3O4 nanoparticles and the single-atom Ce-N4-C-(OH)2 nanozyme have shown promising results in diabetes treatment by enhancing glucose uptake, improving insulin sensitivity, and lowering blood glucose levels, with Fe3O4 nanoparticles activating adenosine 5′-monophosphate-activated protein kinase and single-atom Ce-N4-C-(OH)2 exhibiting superoxide dismutase (SOD)-, oxidase (OXD)-, catalase (CAT)-, and peroxidase (POD)-like activities to independently generate hydroxyl radicals and enhance glucose metabolism [17, 18]. With developments in the field of nanozymes, it has the potential to revolutionise the treatment of metabolic disorders, providing patients with effective and customised treatments to improve the outcomes of metabolic disorders.
The gut microbiota performs a pivotal role in maintenance of gut health and overall wellness. Imbalances in the gut microbiota have been linked to various health conditions, such as inflammatory bowel disease [19], nonalcoholic steatohepatitis [20], and even neurological disorders [21, 22]. Modulating the gut microbiota to restore balance and promote a healthy microbial community is an area of active research. Nanozymes could be used to modulate the gut microbiota by targeting specific microbiota or promoting the growth of beneficial microbiota. For example, nanozymes can be designed to selectively target and inhibit the growth of harmful bacteria while leaving beneficial bacteria unharmed [23, 24]. This could help restore balance to the gut microbiota and promote overall gut health.
Au@Pt nanozymes, composed of gold (Au) core and platinum (Pt) shell, exhibit enzyme-like activities, including POD, CAT, and OXD, making them attractive candidates for various biomedical applications, such as myocardial infarction [25], diabetic wound healing [26, 27], and rheumatoid arthritis [28]. However, the regulatory effects of Au@Pt on glucose and lipid metabolism remain unclear. To elucidate the potential of Au@Pt in regulating glucose and lipid metabolism, we analyzed liver and feces under high-fat diet (HFD) conditions following Au@Pt administration through the integration of multi-omics analysis. We found that Au@Pt was effective in reducing blood glucose levels and serum triglyceride (TG) levels, as well as having no significant effect on body weight. Mechanistically, administration of Au@Pt significantly alters the expression of genes related to glucose and lipid metabolism signaling pathways, including insulin signaling pathway, PPAR signaling pathway, glycolysis/gluconeogenesis, and pyruvate metabolism. Furthermore, 16S rRNA profiling of fecal samples from mice treated with Au@Pt nanozymes showed significant changes in the abundance of certain beneficial gut microbiota, which are strongly associated with alterations in metabolic phenotype. This discovery highlights the potential application of Au@Pt in metabolic disease homeostasis and offers a promising strategy for disorders of metabolic homeostasis.
Materials and methods
Chemical reagents and materials
Dulbecco’s Modified Eagle Medium (DMEM) was obtained from Beijing Solarbio Technology Co., Ltd (Beijing, China). K2PtCl6, HAuCl4·3H2O, and Brij-58 were obtained from Aladdin (Beijing, China). The CAT detection kit, the SOD detection kit, the reactive oxygen species (ROS) detection kit (DCFH-DA), and the cell viability detection kits were acquired from Shanghai Beyotime Biotechnology Co., Ltd (Shanghai, China).
The Au@Pt nanozyme preparation
The synthesis of Au@Pt nanozymes was in accordance with a previously conducted study. To briefly summarize the synthesis process: 40 mg of Brij@58 was solubilized in 4 mL of distilled water, then 0.1 mL of 0.05 M HAuCl4, 0.45 mL of 0.05 M K2PtCl6, and 1 mL of 0.25 M ascorbic acid (AA) were added. Upon addition of AA, the mixture changed color to red, indicating the formation of an Au core. The color then changes from red to purple and then to black within 1 min, indicating that Pt is growing on the Au surface. The optical images capturing the change in color are shown in the supporting information in Fig. S1. The reaction was carried out by stirring the mixture at 60 °C for 1 h. After completion of the reaction, the nanomaterials were three times washed with water and ethanol.
Characterization of Au@Pt nanozyme
X-ray diffraction (XRD) data was recorded by a Bruker D8 Advance diffractometer. Transmission electron microscopy (TEM) images were carried out by an FEI-TALOS-F200X microscope. X-ray photoelectron spectroscopy (XPS) analysis was carried out on a Thermo Fisher Scientific K-Alpha. Fourier transform infrared (FTIR) analyses were carried out with a FTIR spectrometer (Thermo Nicolet IS5, BRUKER TENSOR II). Inductively coupled plasma mass spectrometry (ICP-MS) was performed by use of an AGILENT 5100.
Cell culture
HepG2 cells (Chinese Academy of Sciences Stem Cell Bank) were incubated in DMEM with 10% fetal bovine serum (PANBiotech) and 1% penicillin–streptomycin (Gibco). All cells were cultured at 37 °C with 5% CO2.
The effect of the Au@Pt nanozyme on ROS in HepG2 cells
HepG2 cells (4 × 10⁵ cells/mL) were cultured in 6-well dishes and inoculated for 24 h. After 24 h of incubation and addition of palmitic acid, the treatment of cells with 20 μM DCFH-DA for 30 min was performed to measure the intracellular ROS level. Then, an appropriate amount of Hoechst 33,342 live cell stain was added to the culture medium homogenously, mixed gently, and incubated for 20 min. Then cells were washed and observed under a fluorescence microscope (IX71, Olympus, Japan).
The effect of the Au@Pt nanozyme on glucose uptake in HepG2 cells
HepG2 cells (4 × 10⁵ cells/mL) were treated with the Au@Pt nanozyme for 24 h. Glucose residue in the cell culture supernatant was then collected, centrifuged, and determined using a glucose kit (glucose oxidase method) (Nanjing Jiancheng, Nanjing, China).
Hemolysis assay
The hemocompatibility of nanoparticles was investigated by a hemolysis assay [29, 30]. Different concentrations (0–500 μg/mL) of Au@Pt were incubated with 2% rabbit red blood cells at 37 °C for 2 h. The cells were then centrifuged at 1000 rpm for 5 min and the supernatant absorbance was recorded using a microplate detector at 545 nm. 0.9% NaCl and ultrapure water were used as the negative and positive standards for hemolysis, respectively. The hemolysis rate was calculated from the measured absorbance. Hemolytic rate = 100% × [(ODsa–ODneg)/(ODpos–ODneg)]. ODsa: Abs of the experimental group; ODneg: Abs of the negative group; ODpos: Abs of the positive group.
The experiment of mice in vivo
This experiment was approved by the Animal Ethics Committee of China Agricultural University (approval number: AW62113202-4–1). Animal studies were conducted in the specific pathogen-free animal house of the Beijing Agricultural Products Quality Supervision, Inspection and Testing Centre of the Ministry of Agriculture. Six-week-old C57BL/6 J male mice were obtained from Beijing Vitality River Laboratory Animal Technology Co. After a 1-week acclimatization period, the mice were divided into groups receiving either a chow diet (HFK Bioscience Co. Ltd.) or a HFD (Research Diet, D12492), with the Au@Pt group receiving the HFD along with a daily oral administration of 10 mg/kg Au@Pt. All mice underwent the intervention for 4 weeks.
Oral glucose tolerance test (OGTT)
After 4 weeks of feeding, mice were subjected to OGTT after 6 h of fasting (8:00 am to 2:00 pm) by orally administering 2 g of glucose per kilogram of body weight. Blood glucose was then measured with a glucometer by collecting blood from the tip of the tail vein of the mice at 0, 15, 30, 60, 90, and 120 min after glucose was given.
Hematoxylin–eosin (H&E) staining
Immediately, the liver, spleen, testis, epididymis, and colon were immerged in 4% formaldehyde. Then it was imbedded in paraffin, sectioned, and stained with H&E. The staining sections were analyzed using an optical microscope (Olympus, Tokyo, Japan).
Blood biochemistry analysis
The serum biochemical indexes of mice were detected using a kit from Biosino Bio-Technology and Science Co., Ltd. with a blood biochemistry analyzer (Technicon RA-1000, USA). The biochemistry indexes measured included aspartate aminotransferase (AST), alanine aminotransferase (ALT), urea, lactic dehydrogenase (LDH), cholesterol (CHO), triglycerides (TG), low-density lipoprotein (LDL), and high-density lipoprotein (HDL).
RNA extraction and qPCR
Total RNA was extracted from the liver using TRIzol (Invitrogen) and the quantity was quantified with a Nano 300 spectrophotometer (Allsheng Co., Ltd.). Followed by cDNA synthesis and qPCR using the FastKing RT Kit (with gDNase) (Tiangen) and the universal SYRB qPCR Master Mix (Biosharp Life Science, Anhui, China) according to the manufacturer’s instructions respectively. Relative alterations in mRNA expression were measured by the ΔΔCt method and standardized to β-actin. Table S1 lists all primer sequences used.
Transcriptome analysis
Liver transcriptome analyses for RNA purification, reverse transcription, library construction, and sequencing were carried out at Shanghai Majorbio Bio-pharm Biotechnology Co., Ltd. (Shanghai, China). Briefly, DESeq2 or DEGseq was used for differential expression analysis [31, 32]. |log2FC|≥ 1 and FDR ≤ 0.05 (DESeq2) or FDR ≤ 0.001 (DEGseq) differentially expressed genes (DEGs) were considered to be significantly differentially expressed genes. Furthermore, an enrichment analysis of function involving GO and KEGG was conducted to determine the DEGs that were markedly enriched in GO terms as well as metabolic pathways compared to a transcriptome-wide background at Bonferroni-corrected p-values ≤ 0.05.
Gut microbiota analysis
E.Z.N.A. Fecal DNA Kit (Omega Bio-tek, Inc.) was used for fecal genomic DNA extraction. Universal primers 338F (5ʹ-ACTCCTACGGAGGCAGCAG-3ʹ) and 806R (5ʹ-GGACTACNNGGGGTATCTAAT-3ʹ) were used to amplify the V3-V4 hypervariable region of 16S rRNA gene of bacteria. Deep sequencing was conducted on the Illumina Miseq/Novaseq (Illumina, Inc., USA) platform at Beijing Allwegene Technology Co., Ltd. An analysis was performed utilizing Linear Discriminant Analysis Effect Size (LEfSe) to discover bacterial taxa that varied significantly, with statistical significance determined by a p-value < 0.05 and an LDA score exceeding 4. Predicted functional profiles of the microbial communities were then generated via PICRUSt2, with subsequent assessment of statistically significant differences carried out using STAMP.
Statistical analysis
All data in this study were expressed as mean ± standard error. Statistical analyses were performed using the student’s t-test to compare differences between the two groups, and one-way ANOVA or two-way ANOVA for multiple groups. The GraphPad Prism 10 was used for all statistical analyses and significance was set at *p < 0.05, **p < 0.01, ***p < 0.001, and ****p < 0.0001.
Results and discussion
Characterization of Au@Pt nanozyme
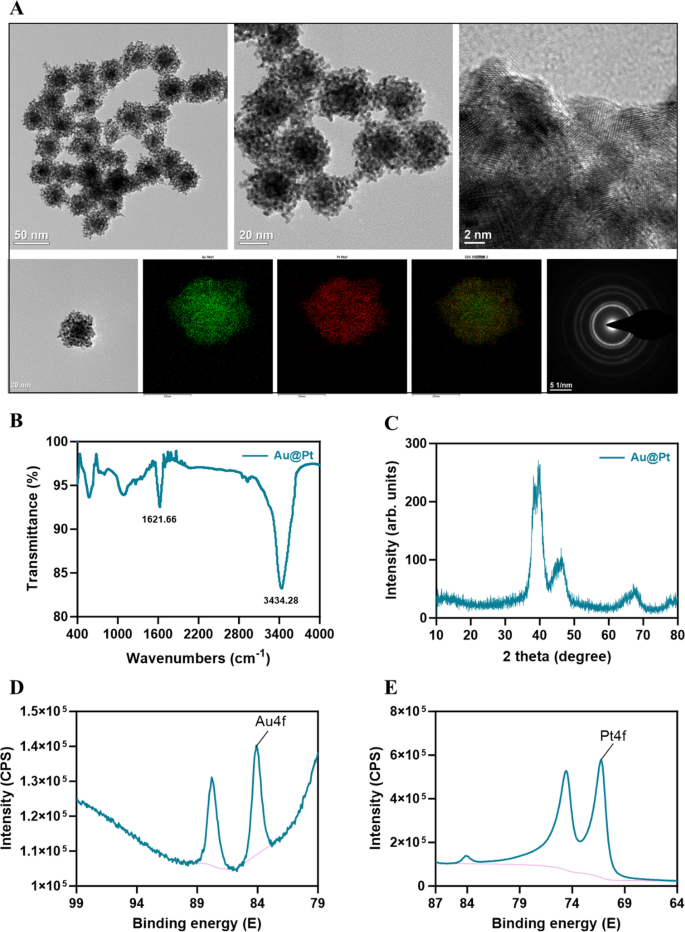
Au@Pt nanozyme was synthesized by a one-step co-reduction approach [33]. As shown in the TEM image (Fig. 1A), Au@Pt NPs demonstrate a dendritic morphology and the diameter was 30–50 nm. We used EDS elemental mapping analysis to detect the spatial arrangement of the two metal elements in the Au@Pt. The green particles representing Au are more densely distributed in the center than in the periphery, thus confirming that Au is predominantly distributed in the nuclear structure. The red particles representing the element Pt are distributed in the shell (Fig. 1A). Au@Pt is a bimetallic nanoparticle with a core–shell structure that is highly mesoporous in nature. FTIR was used to determine potential interactions between surface biomolecules and metal ions, which contribute to the comprehension of the Au@Pt nanozymes’ mechanism of biosynthesis (Fig. 1B). The crystal structures of the prepared samples were detected by XRD. Figure 1C shows the XRD patterns of Au@Pt nanozyme. To understand the mode of binding further, we used XPS to investigate the composition of surface elements, structural details, and chemical states, as shown in Fig. 1D, E, the main peaks at 84.08 (4f) and 87.80 (4f) were attributed to Au0+, while the peaks at 74.6 (4f) and 71.25 (4f) were characteristic of Pt0+ species. Most importantly, we found that Au@Pt exhibited excellent POD, CAT, and SOD-like activities.
Au@Pt improves glucose tolerance and reduces TG
To confirm the effect of Au@Pt on body composition, the organ mass was determined in normal diet, HFD, and Au@Pt administration group mice. A HFD for 4 weeks resulted in significant increases in epididymal fat weight, body weight, inguinal fat weight, visceral fat weight, perirenal fat weight, and adipocyte area in mice (Fig. S2A–2F). While, compared to the HFD group, the administration of Au@Pt showed a trend of reducing these indicators, but did not exhibit significant differences (Fig. S2A–S2F). Given the limited intervention period of 4 weeks for Au@Pt, any observed effects on body weight and organ weight may exhibit a decreasing trend; however, no statistically significant differences were identified. Future studies could use interventions that mimic natural products, such as obesity or diabetes models before implementing substance interventions [34, 35]. Furthermore, extending the duration of dietary and material co-interventions to 8–12 weeks could strengthen the robustness of the findings.
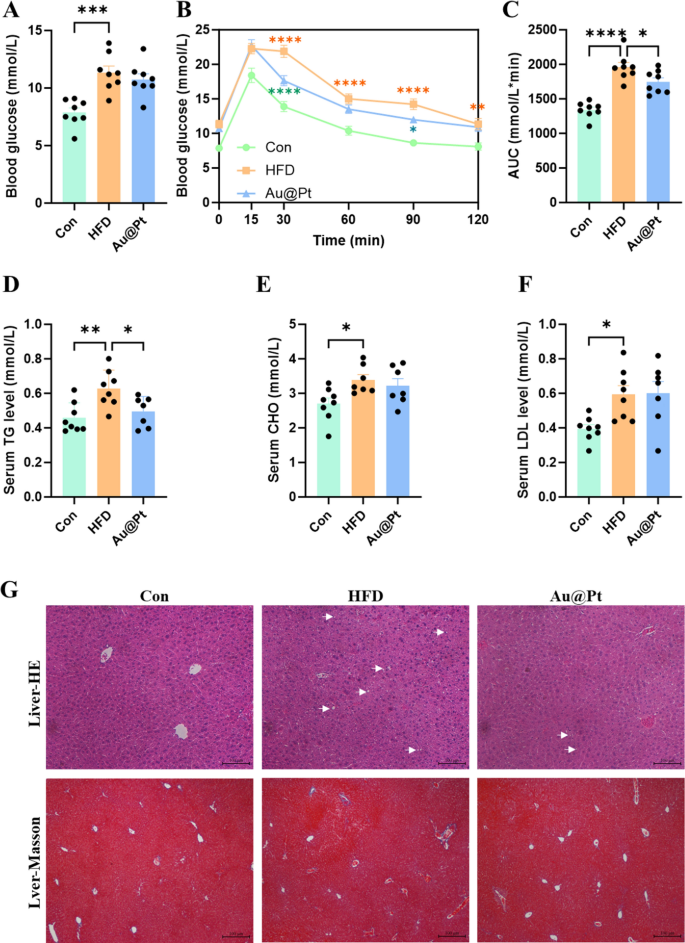
To further investigate the impact of Au@Pt on glucose metabolism, we conducted fasting blood glucose testing as well as a glucose tolerance test. As shown in Fig. 2A–C, HFD significantly impairs glucose tolerance and increases the area under the curve (AUC) of OGTT compared to a normal diet. Notably, Au@Pt significantly improved glucose tolerance and decreased the AUC of OGTT, but did not affect fasting plasma glucose (Fig. 2A–C). In current research, metabolic abnormalities induced by a HFD also are shown as the increase of blood lipids (Fig. 2D–F), liver lipid accumulation (Fig. 2G), hypertrophic adipose tissue cells (Fig. S2F and S2J), and unaffected liver weight and liver function indicators (Fig. S2G-S2I). Meanwhile, Au@Pt treatment significantly reduced blood TG levels, hepatic lipid accumulation, and fibrosis compared to the HFD group (Fig. 2D, G). Taken together, the analyses above clearly elucidated that Au@Pt improves glucose tolerance and reduces TG.
Transcriptional profiles analysis of Au@Pt treated mice liver
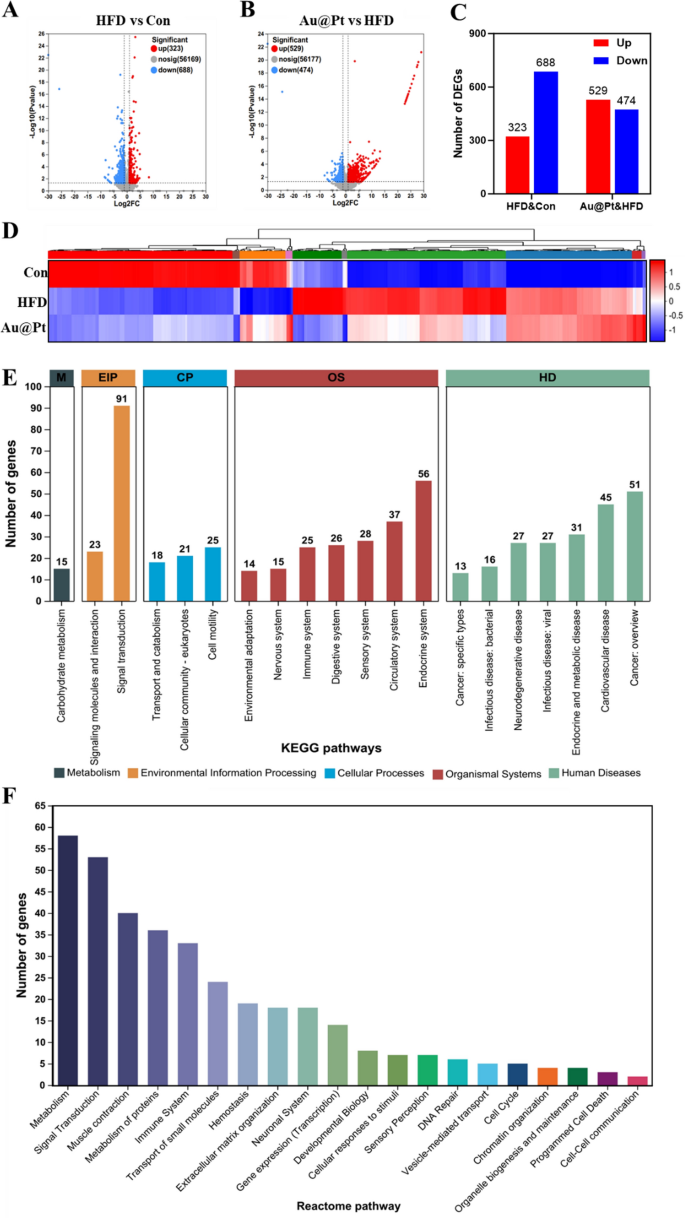
Considering that the liver performs an essential role in the body’s glucose and lipid metabolism [36, 37], to further explore the improvement effect of Au@Pt on glucose and lipid metabolism disorders, we conducted a transcriptome profile of liver. As illustrated in Fig. 3A–C, between the HFD group and the control group there were 1011 DEGs, of which 323 had increased expression and 688 had decreased expression (log2|fold change|> 1 and p < 0.05). Meanwhile, Au@Pt administration significantly up-regulated 529 genes and down-regulated 474 genes compared to the HFD group (log2|fold change|> 1 and p < 0.05). DEGs heatmaps were generated to elucidate the effects of Au@Pt ingestion on gene expression alterations in the liver. As depicted in Fig. 3D, oral administration of Au@Pt effectively reversed the gene expression changes induced by HFD. Next, we performed KEGG and Reactome annotation of the DEGs to identify the genes of interest for further analysis. As shown in Fig. 3E, the most abundant terms related to environmental information processing (EIP) and organismal systems (OS) were associated with signaling transduction and the immune system. Notably, the two most highly regulated Reactome pathways were those related to metabolism and immune system signal transduction. These results suggested that the main impact of Au@Pt on the transcriptional profile was focused on metabolism and signal transduction.
Transcriptomic analysis of liver. A and B The volcanic map of DEG distribution; C The number of DEGs; D Heat map plots for DEGs; E The histogram of KEGG; F Reactome annotations analysis. HD: Human Diseases; OS: Organismal Systems; CP: Cellular Processes; EIP: Environmental Information Processing; M: Metabolism
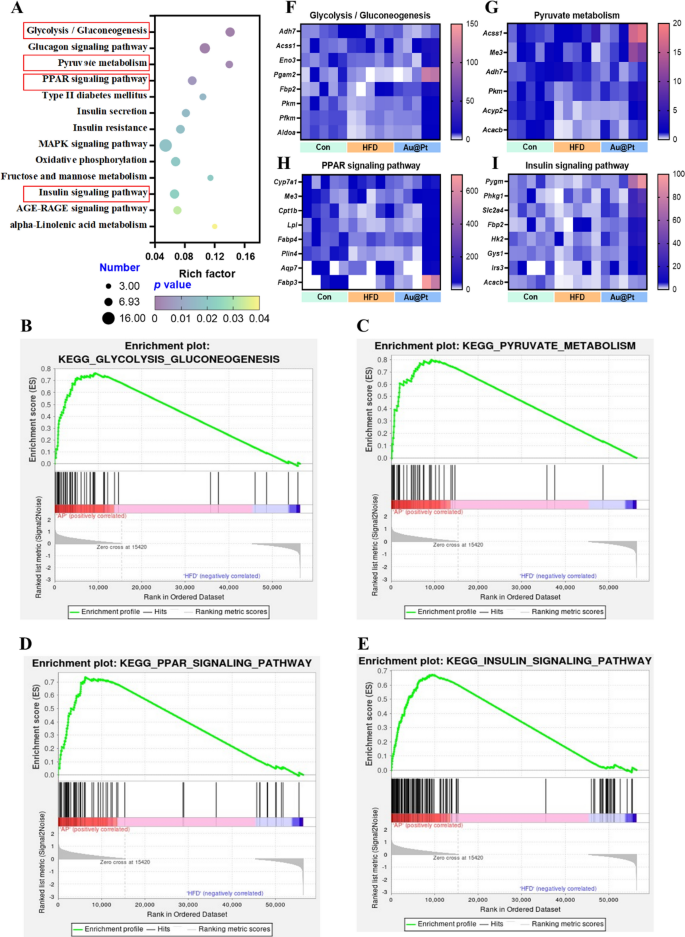
To further elucidate the major modulation signaling pathways involved in DEGs, KEGG and GSEA analyses were performed, respectively. Firstly, the 13 most important KEGG pathway related to metabolism were classified and ranked according to enrichment scores (p < 0.05) (Fig. 4A). There were 21 different signaling pathways between HFD and control group (p < 0.05) and 22 different signaling pathways between Au@Pt and HFD group (p < 0.05) (Table S2). Interestingly, in the GSEA analysis, we enriched 7 important signaling pathways, which were positively correlated with the control group and Au@Pt group and negatively correlated with the HFD group, mainly including GnRH signaling pathway, glycolysis/gluconeogenesis, lysosome, olfactory transduction, glutathione metabolism, long term depression, and neurotrophin signaling pathway (Fig. S3). These results suggest that Au@Pt can change in the direction of the Control group by reversing the above signaling pathways affected by HFD.
Notably, our comprehensive analysis of the above differential gene KEGG-enriched signaling pathways and the gene-wide GSEA signaling pathway identified four intersecting important signaling pathways including glycolysis/gluconeogenesis, pyruvate metabolism, PPAR signaling pathway, and insulin signaling pathway (Fig. 4A–E). Then, the key genes enriched in these pathways were heat-mapped between control, HFD, and Au@Pt group (Fig. 4F–I). Taken together, the analyses above clearly elucidated that Au@Pt modulates glucose and lipid metabolism homeostasis may be associated with glycolysis/gluconeogenesis, insulin signaling pathway, PPAR signaling pathway, and pyruvate metabolism. To further verify the differences in the above signaling pathways, the expression of key genes was verified by qRT-PCR (Fig. S4).
Analysis of key genes regulated by Au@Pt in the liver
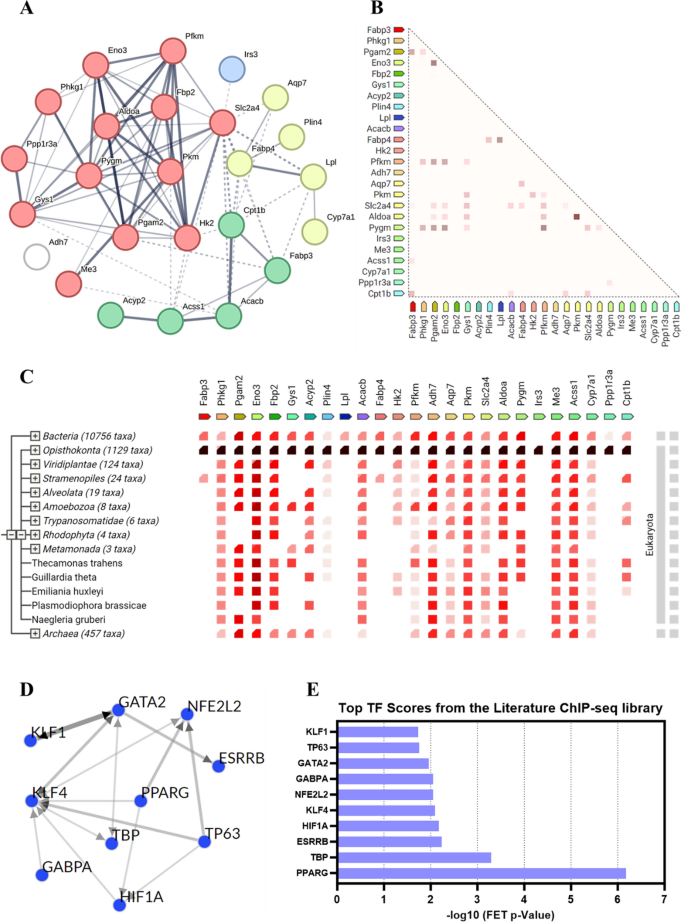
To further explore how the key genes regulated by Au@Pt play a role in modulating the homeostasis of glucose and lipid metabolism in the body, we selected 25 genes in the above 4 key signaling pathways for the protein–protein interactions (PPI) analysis and transcription factor (TF) analysis. PPI network analysis was performed using the STRING 12.0 database to identify the key gene targets in key pathways affected by Au@Pt (Table S3), and the results showed that the highest interaction was Pgam2 and Eno3, followed by Pkm and Aldoa (Fig. 5A). As shown, the proteins with the highest correlation of gene expression are Pkm and Aldoa, followed by Pgam2 and Eno3 (Fig. 5B). As indicated by cooccurrence interactions, gene families with similar patterns appear in the genome (Fig. 5C). TF enrichment was performed on DEGs in key pathways using ChEA3 to investigate potentially upstream TFs related to variants observed in the literature based on CHIP-seq. As shown in Fig. 5D, E, the top 10 TF from the literature ChIP-seq library as PPARG, TBP, ESRRB, HIF1A, KLF4, NFE2L2, GABPA, GATA2, TP63, and KLF1. Recently, some researchers reported that the regulation of PKM2 and HK2 expression by the PPARg and HIF1α-PPARg axis plays important roles in glucose and lipid metabolism, including mediating glycolysis, liver steatosis, hypertrophy, and hyperplasia [38, 39]. Collectively, the potential role of Au@Pt in glucose and lipid metabolism may affect downstream signaling pathways by regulating TFs such as HIF1a and PPARg.
The regulatory effect of Au@Pt on glucose and lipid metabolism in hepatocytes
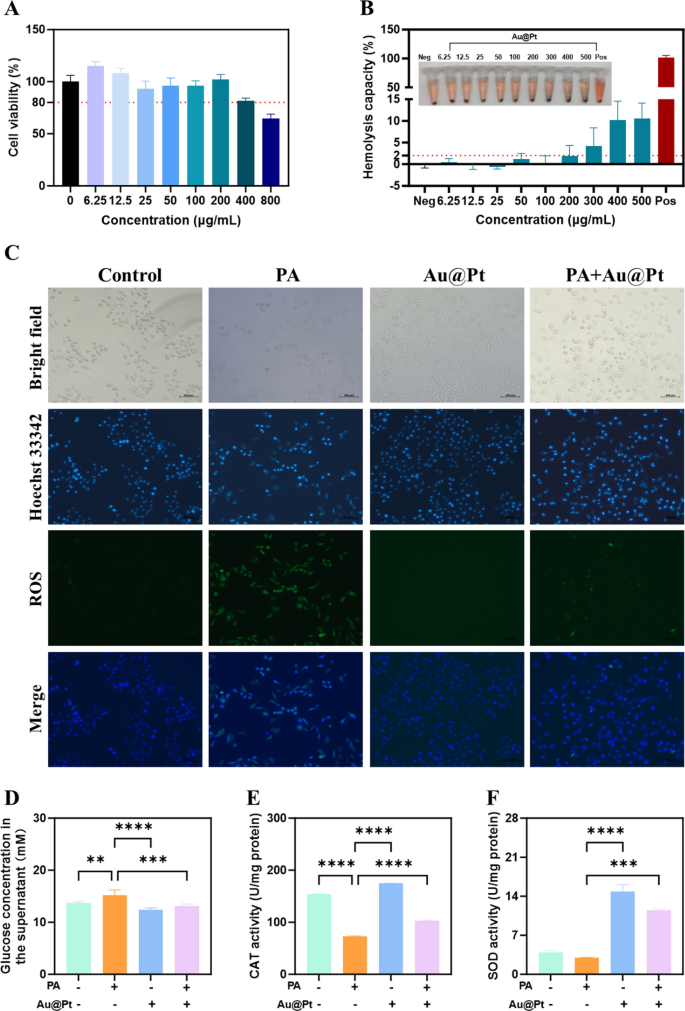
To further investigate the regulatory effects of Au@Pt on glucose and lipid metabolism at the cellular level in vitro, we performed this experiment in human hepatocyte cell lines HepG2 cell. Firstly, after 24 h of incubation with Au@Pt, HepG2 cells retained > 80% viability across Au@Pt at concentrations ranging from 0–200 μg/mL (Fig. 6A). Biocompatibility is essential for the translation of nanozymes into clinical applications [40,41,42]. Then, we incubated rabbit red blood cells with varying Au@Pt concentrations (0–500 μg/mL) at 37 °C for 2 h to evaluate the biocompatibility of the Au@Pt in the blood circulation. As shown in Fig. 6B, no significant hemolysis (less than 2%) was observed at concentrations from 0 to 200 μg/mL after incubation of Au@Pt with red blood cell suspension, indicating that the Au@Pt had good biological safety. It is interesting to note that in contrast to the overactive ROS generation induced by palmitic acid (PA) in HepG2 cells (Fig. 6C), the PA + Au@Pt group showed a significant reduction in the accumulation of ROS. Besides, compared with PA, Au@Pt significantly reduced glucose concentration in the supernatant (Fig. 6D). Consistent with the Au@Pt enzyme-like activity, we found that Au@Pt also increased the CAT and SOD activity under conditions of PA stimulation (Fig. 6E, F).
The modulation of gut microbiota by Au@Pt
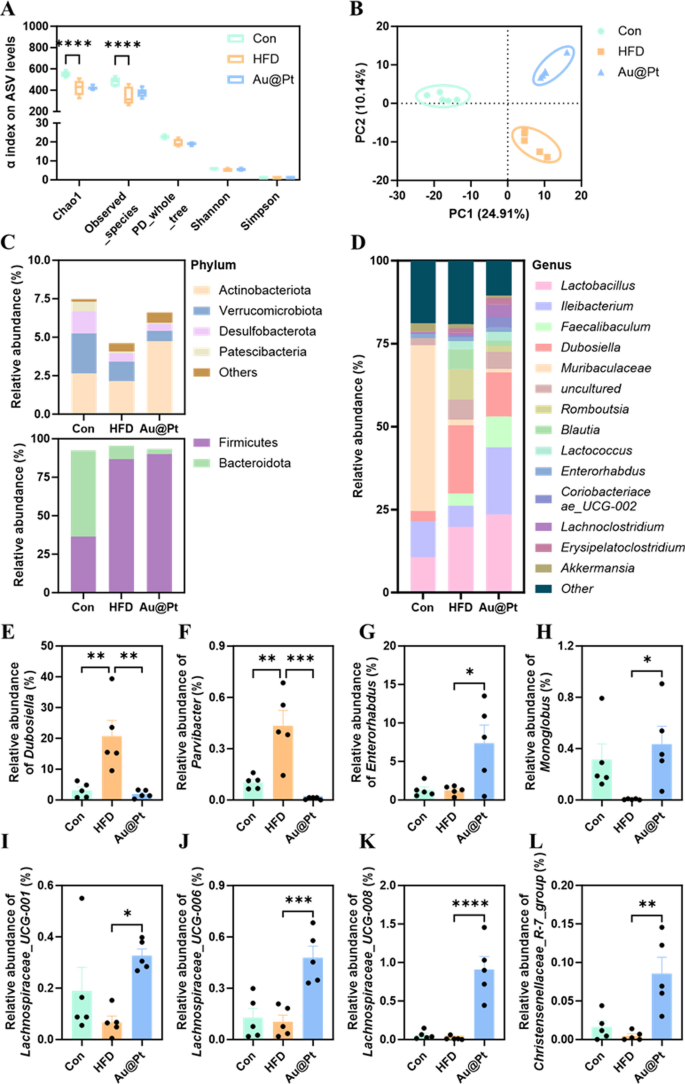
An increasing number of studies have shown that disorders of the gut microbiota and its metabolites can severely influence the onset and progression of metabolic disorders [43,44,45]. To unravel the modulatory effects of Au@Pt on the gut microbiota, high-throughput 16S rRNA gene sequencing of the V3-V4 region was performed to investigate the changes in the microbial community. α-Diversity analysis showed that the microbial community of mice in the HFD group showed a significant decrease in diversity (Chao and observed species) and richness (observed ASVs) compared to the control and Au@Pt groups (Fig. 7A). Moreover, β diversity analysis based on Bray–Curtis revealed that the structures of the bacterial communities in the Au@Pt-treated mice were comparable to the mice in the control group along PC2, the relationship between Au@Pt and HFD along PC1 appears to be similar, and that the groups are indeed dispersed along PC2 (Fig. 7B). Changes in the structure of the gut microbiota community in control, HFD, and Au@Pt mice were associated with altered patterns of relative abundance, which were seen at both the phylum and genus level (Fig. 7C, D).
Structural and compositional analysis of the gut microbiota. A α diversity displayed by observed ASV levels; B PLS-DA plot analysis of β-diversity of the gut microbiota; The gut microbiota relative abundance at the C phylum and D genus level; E–L The relative abundance of Dubosiella, Parvibacter, Enterorhabdus, Monoglobus, Lachnospiraceae_UCG-008, Lachnospiraceae_UCG-006, Lachnospiraceae_UCG-001, and Christensenellaceae_R-7_group at genus levels
In particular, we found a significant increase in the relative abundance of Dubosiella and Parvibacterat genus levels in HFD-fed mice, while Au@Pt administration significantly decreased these relative abundances to be consistent with the control group (Fig. 7E, F). Similarly, oral intake Au@Pt significantly increased the relative abundance of Enterorhabdus, Monoglobus, Lachnospiraceae_UCG-008, Lachnospiraceae_UCG-006, Lachnospiraceae_UCG-001, and Christensenellaceae_R-7_group compared with HFD at genus levels (Fig. 7G–L).
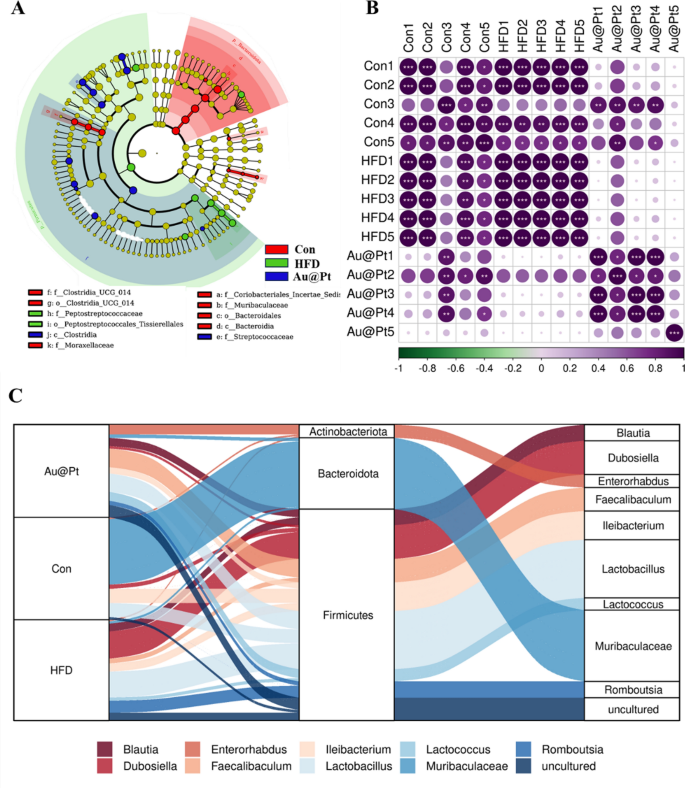
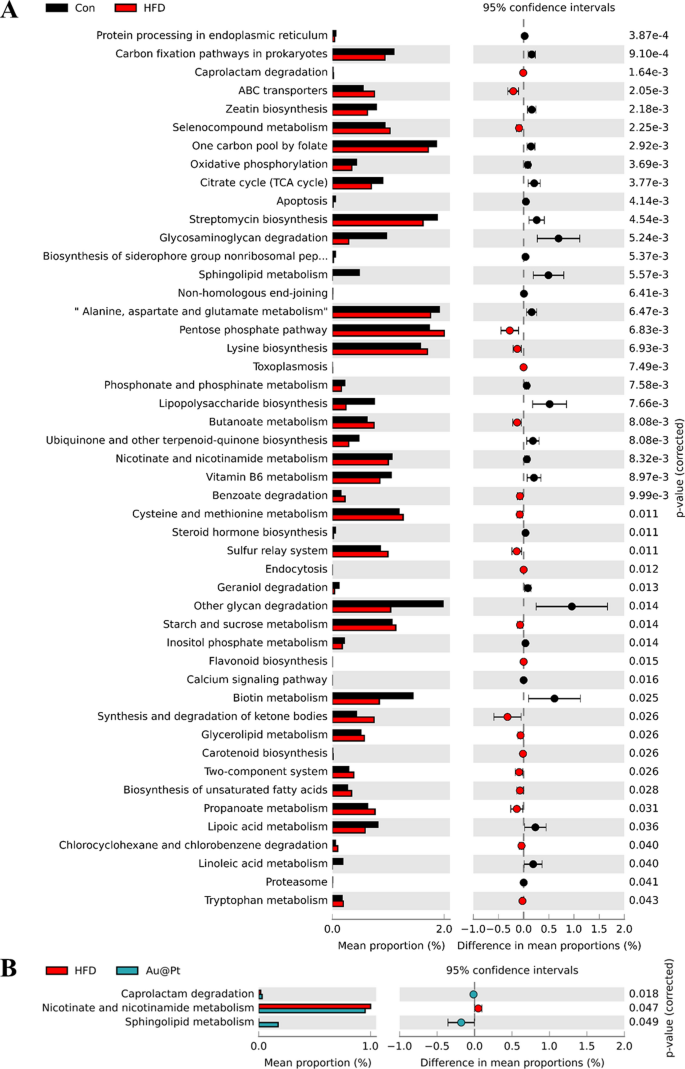
Heat map of dominant genera was analysed and the results showed that the number of dominant genera showed an increasing trend after Au@Pt treatment (Fig. 8A). To determine the specific taxa of microorganisms affected by Au@Pt in HFD-fed mice, LEfSe analyses were performed ranging from the phylum level to the species level, with significance defined as p < 0.05 and LDA scores > 4 (Fig. 8B). In addition, the correlation of gut microbiota among the three groups also indicated that Au@Pt supplementation reversed the changes induced by a HFD and tended to align more closely with the control groups and showed a positive correlation (Fig. 8C). We conducted a thorough characterization of the alterations in gut microbiota composition in HFD-fed mice subjected to treatment with Au@Pt, employing Sankey diagrams to visualize the changes at both the phylum and species levels (Fig. 8D). In PICRUSt2, 16S rRNA gene sequencing data from the gut microbiota are coupled with commonly available database sets to predict of the functional profile of the gut microbiota and to create a functional “map” [46, 47]. As shown in Fig. 9A, samples from the HFD group and the control group primarily differed in the following metabolic pathways related to glucose and lipid metabolism: citrate cycle, phosphonate and phosphinate metabolism, steroid hormone biosynthesis, sucrose, and starch metabolism, biosynthesis of unsaturated fatty acids, propanoate metabolism, lipoic acid metabolism, and linoleic acid metabolism. Compared to HFD mice, caprolactam degradation, nicotinate and nicotinamide metabolism, and sphingolipid metabolism were significantly altered after Au@Pt administration (Fig. 9B).
The different gut microbiota analysis at genus levels. A Bacterial taxa showing different abundances between control, HFD, and Au@Pt group; B The correlation of gut microbiota among control, HFD, and Au@Pt group; C Sankey diagrams analysing the relative abundance of gut microflora at phylum level (left) and genus level (right) for samples from control, HFD, and Au@Pt groups
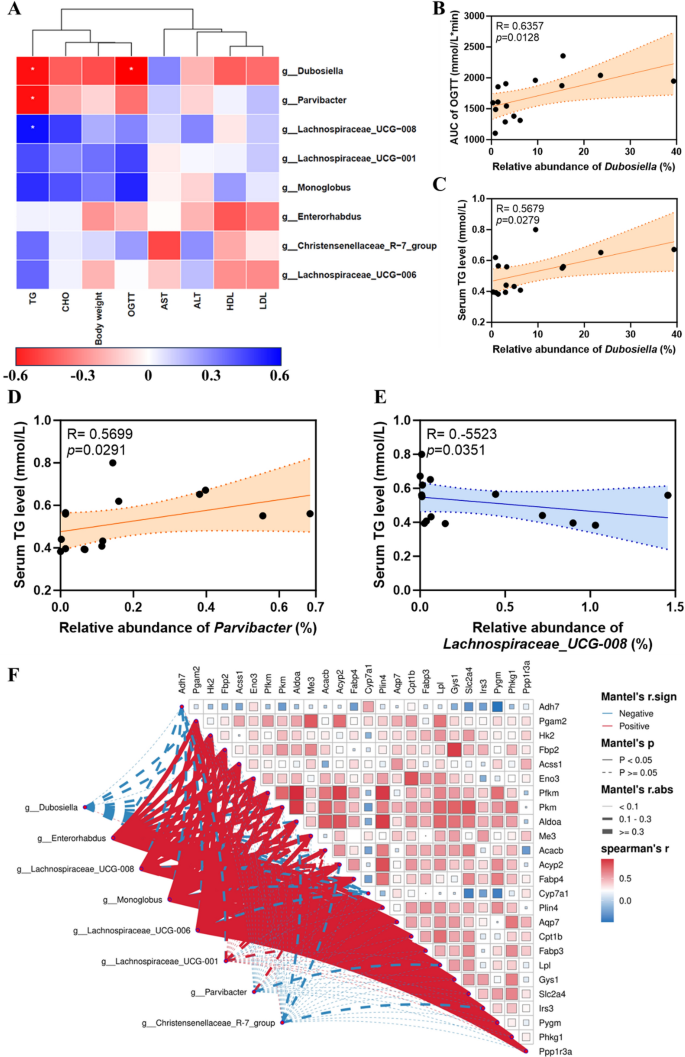
Then, we analysed the association between 16S rRNA results and metabolic indices. The results showed that differences in serum TG levels were positively correlated with Dubospora and Parvibacter at the taxonomic level of the genus (Fig. 10A, C, D) but negatively correlated to Lachnospiraceae_UCG-008 (Fig. 10A, E). The difference in the AUC of OGTT was positively correlated to Dubosiella (Fig. 10A, B). The AUC of OGTT differences had a positive correlation with Dubosiella. Taken together, these findings suggest that the regulation of Au@Pt on glucose and lipid metabolism may be associated with altered composition and structure of the gut microbiota. Moreover, the heat map of the correlation network also suggested that there was a close correlation between the differential genes and the differential gut bacteria (Fig. 10F). Overall, gut microbiota may be an important target for understanding the metabolic homeostasis regulated by Au@Pt, which also provides an important theoretical basis for promoting Au@Pt to clinical application. The use of nanozyme in modulating the gut microbiota holds promise for the development of new strategies for promoting gut health and treating gut-related disorders. Additional investigations are required to fully understand nanozymes’ potential in this area and to develop safe and effective nanozyme-based therapies for modulating gut microbiota.
Analysis of correlation between metabolic index and gut microbiota. A Analysis of metabolic index with differential gut microbiota at genus level; B Spearman’s correlation analysis of the AUC of OGTT with the relative abundance of Dubosiella; C Spearman’s correlation analysis of the relative abundance of Dubosiella with serum TG levels; D Spearman’s correlation analysis of the relative abundance of Parvibacter with serum TG levels; E Spearman’s correlation analysis of the relative abundance of Lachnospiraceae_UCG-008 with serum TG levels; F The heat map of correlation network of differential genes and differential gut bacteria
The pharmacokinetic and biosafety analysis of Au@Pt
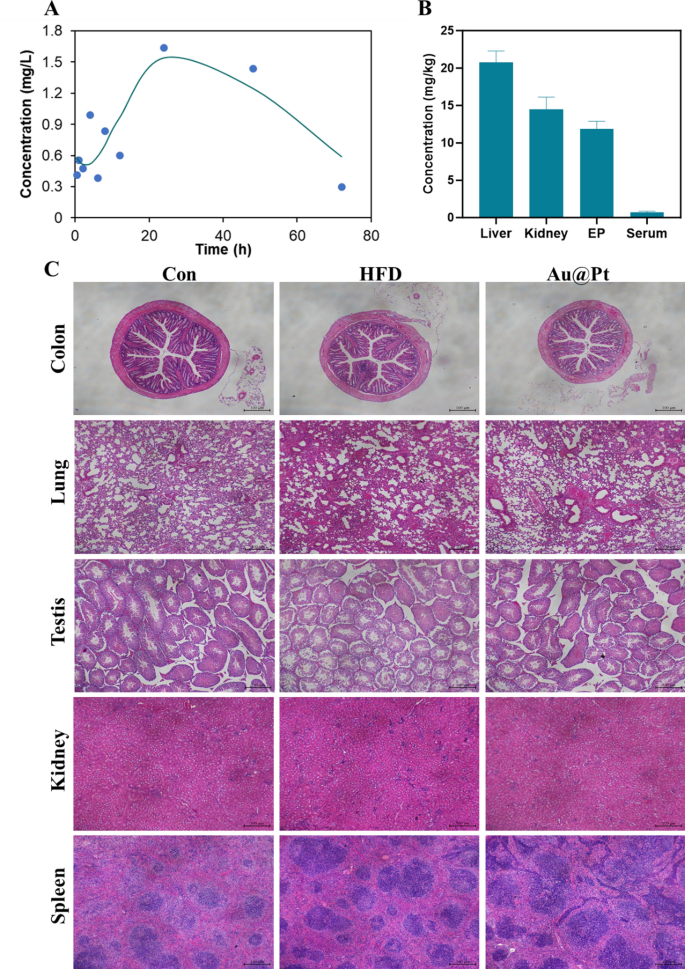
The pharmacokinetics and the in vivo metabolic profile of Au@Pt in a mouse model were investigated. To assess the circulatory situation of Au@Pt, we conducted measurements of the Pt element content in the serum at different time points (0.5, 1, 2, 4, 6, 8, 12, 24, 48, and 72 h) using ICP-MS. As shown in Fig. 11A and Table S4, the elimination half-life (t1/2) of Au@Pt was calculated as 13.506 h in a two-compartment pharmacokinetic model. The mean residence time (MRT) and the time to peak (Tmax) of Au@Pt in the body were determined to be 57.437 h and 24 h based on the pharmacokinetics data respectively. Subsequently, we measured the levels of Au@Pt in different tissues after administered for 4 weeks, and the data from the study indicated that the highest levels were in the liver, followed by the kidney and epididymal fat, and lower levels in the serum relative to the different tissues (Fig. 11B).
The biosafety of Au@Pt is vital for future applications, especially for clinical treatment. Firstly, we evaluated the biocompatibility of Au@Pt in vitro, as shown in Fig. 6D, no significant hemolysis (less than 2%) was observed after incubation of Au@Pt with red blood cell suspension, indicating that the Au@Pt had good biological safety. In addition, we have conducted several studies on the biosafety of Au@Pt during in vivo experiments. According to the different organ weights (Fig. S2), the Au@Pt did not influence the weight changes of organ tissue. Analyses of blood biochemistry revealed that Au@Pt did not impair liver biochemistry and function, kidney function, or other serum parameters (Fig. 11A–F). Similarly, there was no visible pathological injury to the organ tissues as revealed by H&E staining (Fig. 11C). These observations suggest that the minimal or even undetectable toxicity of Au@Pt in vitro and in vivo suggests its potential application in the maintenance of metabolic homeostasis. Nanozyme’s unique properties at the nanoscale may also pose risks, particularly regarding neurotoxicity. For example, cellular interactions, oxidative stress, inflammatory response, passage across the blood–brain barrier, and long-term effects. Considering these factors, a thorough investigation into the neurotoxic effects of nanozymes is essential to ensure their safety in medical applications. Future studies should focus on elucidating the mechanisms of neurotoxicity, assessing the effects on neuronal health, and establishing safety benchmarks for their use in vivo.
Conclusions
Given the pathological microenvironment of characteristics of hyperglycemia and hyperlipidemia in the course of glucose and lipid metabolism disorder, this study prepared Au@Pt with a relatively simple composition, high activity, and controllable biosafety. We found that the intake of Au@Pt nanozyme can not only ameliorate glucose tolerance but also reduce serum TG content. The expression of genes related to glycolipid metabolism signaling pathways such as insulin signaling pathway, glycolysis/glucuronidation, PPAR signaling pathway, and pyruvate metabolism was significantly changed after administration of Au@Pt. Furthermore, analyses of 16S rRNA profiling of fecal samples of mice treatment by Au@Pt nanozyme presented significant changes in the abundance of certain beneficial gut microbiota, which are strongly associated with alterations in metabolic phenotype. In addition, it could effectively eliminate ROS against oxidative stress damage and enhance the activity of CAT and SOD of hepatocytes in the inflammation microenvironment in vitro. Overall, this study emphasizes the potential of Au@Pt nanozyme being a prospective nanomaterial in the modulation of metabolic pathways and offers valuable insights into the application of integrated multi-omics analysis for studying nanozyme-based therapeutics in the context of metabolic disorders.
Availability of data and materials
No datasets were generated or analysed during the current study.
Abbreviations
- AA:
-
Ascorbic acid
- ALT:
-
Alanine aminotransferase
- AST:
-
Aspartate aminotransferase
- AUC:
-
Area under the curve
- CAT:
-
Catalase
- CHO:
-
Cholesterol
- CP:
-
Cellular processes
- DEGs:
-
Differentially expressed genes
- DMEM:
-
Dulbecco’s Modified Eagle Medium
- EIP:
-
Environmental information processing
- FTIR:
-
Fourier transform infrared
- HD:
-
Human diseases
- HDL:
-
High-density lipoprotein
- H&E:
-
Hematoxylin–eosin
- HFD:
-
High-fat diet
- ICP-MS:
-
Inductively coupled plasma-mass spectrometry
- LDH:
-
Lactic dehydrogenase
- LDL:
-
Low-density lipoprotein
- LDA:
-
Linear discriminant analysis
- OGTT:
-
Oral glucose tolerance test
- OS:
-
Organismal systems
- OXD:
-
Oxidase
- PA:
-
Palmitic acid
- PLS-DA:
-
Partial least squares discriminant analysis
- POD:
-
Peroxidase
- PPI:
-
Protein–protein interactions
- ROS:
-
Reactive oxygen species
- SOD:
-
Superoxide dismutase
- TEM:
-
Transmission electron microscopy
- TF:
-
Transcription factor
- TG:
-
Triglyceride
- XPS:
-
X-ray photoelectron spectroscopy
- XRD:
-
X-ray diffraction data
References
Blüher M. Obesity: global epidemiology and pathogenesis. Nat Rev Endocrinol. 2019;15:288–98.
Chew NWS, Ng CH, Tan DJH, Kong G, Lin C, Chin YH, et al. The global burden of metabolic disease: data from 2000 to 2019. Cell Metab. 2023;35:414-428.e413.
Morigny P, Boucher J, Arner P, Langin D. Lipid and glucose metabolism in white adipocytes: pathways, dysfunction and therapeutics. Nat Rev Endocrinol. 2021;17:276–95.
Schwartz MW, Seeley RJ, Tschöp MH, Woods SC, Morton GJ, Myers MG, et al. Cooperation between brain and islet in glucose homeostasis and diabetes. Nature. 2013;503:59–66.
Spiegelman BM, Flier JS. Obesity and the regulation of energy balance. Cell. 2001;104:531–43.
Horn JW, Feng T, Mørkedal B, Strand LB, Horn J, Mukamal K, et al. Obesity and risk for first ischemic stroke depends on metabolic syndrome: the HUNT study. Stroke. 2021;52:3555–61.
Balci S, Spanhel K, Sander LB, Baumeister H. Culturally adapting internet- and mobile-based health promotion interventions might not be worth the effort: a systematic review and meta-analysis. NPJ Digit Med. 2022;5:34.
Manoharan D, Wang LC, Chen YC, Li WP, Yeh CS. Catalytic nanoparticles in biomedical applications: exploiting advanced nanozymes for therapeutics and diagnostics. Adv Healthc Mater. 2024.e2400746. https://doi.org/10.1002/adhm.202400746.
Zhang Y, Liu W, Wei G, Liu Q, Shao G, Gu X, et al. Bioinspired nanozymes as nanodecoys for urinary tract infection treatment. ACS Nano. 2024;18:9019–30.
Wu L, Lin H, Cao X, Tong Q, Yang F, Miao Y, et al. Bioorthogonal Cu single-atom nanozyme for synergistic nanocatalytic therapy, photothermal therapy, cuproptosis, and immunotherapy. Angew Chem Int Ed Engl. 2024.e202405937. https://doi.org/10.1002/ange.202405937.
Zhang J, Pan Y, Liu L, Xu Y, Zhao C, Liu W, et al. Genetically edited cascade nanozymes for cancer immunotherapy. ACS Nano. 2024;18:12295–310.
Qiu M, Yuan Z, Li N, Yang X, Zhang X, Jiang Y, et al. Self-assembled bifunctional nanoflower-enabled CRISPR/Cas biosensing platform for dual-readout detection of Salmonella enterica. J Hazard Mater. 2024;471: 134323.
Cho CH, Kim JH, Padalkar NS, Reddy YVM, Park TJ, Park J, et al. Nanozyme-assisted molecularly imprinted polymer-based indirect competitive ELISA for the detection of marine biotoxin. Biosens Bioelectron. 2024;255: 116269.
Liu Y, Zhang J, Cui S, Wei H, Yang D. Perovskite hydroxide-based laccase mimics with controllable activity for environmental remediation and biosensing. Biosens Bioelectron. 2024;256: 116275.
Chang J, Hu R, Zhang J, Hou T, Li F. Two-dimensional metal-organic framework nanozyme-mediated portable paper-based analytical device for dichlorophen assay. Biosens Bioelectron. 2024;255: 116271.
Wang Y, He X, Huang K, Cheng N. Nanozyme as a rising star for metabolic disease management. J Nanobiotechnology. 2024;22:226.
Zhou Y, Liu C, Yu Y, Yin M, Sun J, Huang J, et al. An organelle-specific nanozyme for diabetes care in genetically or diet-induced models. Adv Mater. 2020;32: e2003708.
Song G, Xu J, Zhong H, Zhang Q, Wang X, Lin Y, et al. Single-atom Ce-N4-C-(OH)2 nanozyme-catalyzed cascade reaction to alleviate hyperglycemia. Research (Wash D C). 2023;6:0095.
Hu Q, Li J, Wang T, Xu X, Duan Y, Jin Y. Polyphenolic nanoparticle-modified probiotics for microenvironment remodeling and targeted therapy of inflammatory bowel disease. ACS Nano. 2024;18:12917–32.
Miao G, Guo J, Zhang W, Lai P, Xu Y, Chen J, et al. Remodeling intestinal microbiota alleviates severe combined hyperlipidemia-induced nonalcoholic steatohepatitis and atherosclerosis in LDLR(-/-) hamsters. Research (Wash D C). 2024;7:0363.
Wasén C, Beauchamp LC, Vincentini J, Li S, LeServe DS, Gauthier C, et al. Bacteroidota inhibit microglia clearance of amyloid-beta and promote plaque deposition in Alzheimer’s disease mouse models. Nat Commun. 2024;15:3872.
Moradian H, Gabriel T, Barrau M, Roblin X, Paul S. New methods to unveil host-microbe interaction mechanisms along the microbiota-gut-brain-axis. Gut Microbes. 2024;16:2351520.
Kim HS, Lee S, Lee DY. Aurozyme: a revolutionary nanozyme in colitis, switching peroxidase-like to catalase-like activity. Small. 2023;19: e2302331.
Li J, Sun M, Liu L, Yang W, Sun A, Yu J, et al. Nanoprobiotics for remolding the pro-inflammatory microenvironment and microbiome in the treatment of colitis. Nano Lett. 2023;23:8593–601.
Liu W, Zhao N, Yin Q, Zhao X, Guo K, Xian Y, et al. Injectable hydrogels encapsulating dual-functional Au@Pt core-shell nanoparticles regulate infarcted microenvironments and enhance the therapeutic efficacy of stem cells through antioxidant and electrical integration. ACS Nano. 2023;17:2053–66.
Zhang B, Lv Y, Yu C, Zhang W, Song S, Li Y, et al. Au-Pt nanozyme-based multifunctional hydrogel dressing for diabetic wound healing. Biomater Adv. 2022;137: 212869.
Zhang Y, Wen CP, Liu YJ, Li AQ, Guo QY, Zhang X, et al. NIR responsive composite nanomaterials with in-situ deposition of cascaded nanozymes for multiple synergistic therapy of bacterial infection in diabetic mice. Chem Eng J. 2023;470: 144345.
Pan W, Li Z, Qiu S, Dai C, Wu S, Zheng X, et al. Octahedral Pt-MOF with Au deposition for plasmonic effect and Schottky junction enhanced hydrogenothermal therapy of rheumatoid arthritis. Mater Today Bio. 2022;13: 100214.
Dobrovolskaia MA, Clogston JD, Neun BW, Hall JB, Patri AK, McNeil SE. Method for analysis of nanoparticle hemolytic properties in vitro. Nano Lett. 2008;8:2180–7.
de la Harpe KM, Kondiah PPD, Choonara YE, Marimuthu T, du Toit LC, Pillay V. The hemocompatibility of nanoparticles: a review of cell-nanoparticle interactions and hemostasis. Cells. 2019;8:1209.
Love MI, Huber W, Anders S. Moderated estimation of fold change and dispersion for RNA-seq data with DESeq2. Genome Biol. 2014;15:550.
Wang L, Feng Z, Wang X, Wang X, Zhang X. DEGseq: an R package for identifying differentially expressed genes from RNA-seq data. Bioinformatics. 2010;26:136–8.
Shi Q, Zhu C, Fu S, Du D, Lin Y. One-pot fabrication of mesoporous core-shell Au@PtNi ternary metallic nanoparticles and their enhanced efficiency for oxygen reduction reaction. ACS Appl Mater Interfaces. 2016;8:4739–44.
Chang CJ, Lin CS, Lu CC, Martel J, Ko YF, Ojcius DM, et al. Ganoderma lucidum reduces obesity in mice by modulating the composition of the gut microbiota. Nat Commun. 2015;6:7489.
Kumar S, Mittal A, Babu D, Mittal A. Herbal medicines for diabetes management and its secondary complications. Curr Diabetes Rev. 2021;17:437–56.
Li L, Fu J, Liu D, Sun J, Hou Y, Chen C, et al. Hepatocyte-specific Nrf2 deficiency mitigates high-fat diet-induced hepatic steatosis: Involvement of reduced PPARγ expression. Redox Biol. 2020;30: 101412.
Watt MJ, Miotto PM, De Nardo W, Montgomery MK. The liver as an endocrine organ-linking NAFLD and insulin resistance. Endocr Rev. 2019;40:1367–93.
Feng J, Dai W, Mao Y, Wu L, Li J, Chen K, et al. Simvastatin re-sensitizes hepatocellular carcinoma cells to sorafenib by inhibiting HIF-1α/PPAR-γ/PKM2-mediated glycolysis. J Exp Clin Cancer Res. 2020;39:24.
Panasyuk G, Espeillac C, Chauvin C, Pradelli LA, Horie Y, Suzuki A, et al. PPARγ contributes to PKM2 and HK2 expression in fatty liver. Nat Commun. 2012;3:672.
Deshwal A, Saxena K, Sharma G, Rajesh, Sheikh FA, Seth CS, et al. Nanozymes: a comprehensive review on emerging applications in cancer diagnosis and therapeutics. Int J Biol Macromol. 2024;256:128272.
Ahmadi S, Rahimizadeh K, Shafiee A, Rabiee N, Iravani S. Nanozymes and their emerging applications in biomedicine. Process Biochem. 2023;131:154–74.
Zhang H, Lu XF, Wu ZP, Lou XWD. Emerging multifunctional single-atom catalysts/nanozymes. ACS Cent Sci. 2020;6:1288–301.
Fan Y, Pedersen O. Gut microbiota in human metabolic health and disease. Nat Rev Microbiol. 2021;19:55–71.
Takeuchi T, Kubota T, Nakanishi Y, Tsugawa H, Suda W, Kwon ATJ, et al. Gut microbial carbohydrate metabolism contributes to insulin resistance. Nature. 2023;621:389–95.
Takeuchi T, Kameyama K, Miyauchi E, Nakanishi Y, Kanaya T, Fujii T, et al. Fatty acid overproduction by gut commensal microbiota exacerbates obesity. Cell Metab. 2023;35:361-375.e369.
Ferreira RM, Pereira-Marques J, Pinto-Ribeiro I, Costa JL, Carneiro F, Machado JC, et al. Gastric microbial community profiling reveals a dysbiotic cancer-associated microbiota. Gut. 2018;67:226–36.
McHardy IH, Goudarzi M, Tong M, Ruegger PM, Schwager E, Weger JR, et al. Integrative analysis of the microbiome and metabolome of the human intestinal mucosal surface reveals exquisite inter-relationships. Microbiome. 2013;1:17.
Funding
This work was supported by the 2115 Talent Development Program of China Agricultural University.
Author information
Authors and Affiliations
Contributions
Yanan Wang, Xiaoyun He, Nan Cheng, and Kunlun Huang designed the project. Yanan Wang, Qi Zhang, Minrui Kan, and Fei Chang performed the experiments. Yanan Wang analyzed and interpreted the data. Xiaoyun He, Nan Cheng, and Kunlun Huang supervised the overall research. Yanan Wang, Xiaoyun He, and Nan Cheng wrote the manuscript. All authors reviewed and approved the final manuscript.
Corresponding author
Ethics declarations
Ethics approval and consent to participate
The animal study was approved by the Animal Ethics Committee of China Agricultural University (Approval number: AW62113202-4–1).
Consent for publication
All authors declare full consent for publication.
Competing interests
The authors declare no competing interests.
Additional information
Publisher's Note
Springer Nature remains neutral with regard to jurisdictional claims in published maps and institutional affiliations.
Supplementary Information
Rights and permissions
Open Access This article is licensed under a Creative Commons Attribution-NonCommercial-NoDerivatives 4.0 International License, which permits any non-commercial use, sharing, distribution and reproduction in any medium or format, as long as you give appropriate credit to the original author(s) and the source, provide a link to the Creative Commons licence, and indicate if you modified the licensed material. You do not have permission under this licence to share adapted material derived from this article or parts of it. The images or other third party material in this article are included in the article’s Creative Commons licence, unless indicated otherwise in a credit line to the material. If material is not included in the article’s Creative Commons licence and your intended use is not permitted by statutory regulation or exceeds the permitted use, you will need to obtain permission directly from the copyright holder. To view a copy of this licence, visit http://creativecommons.org/licenses/by-nc-nd/4.0/.
About this article
Cite this article
Wang, Y., Zhang, Q., Kan, M. et al. Multi-omics analysis of Au@Pt nanozyme for the modulation of glucose and lipid metabolism. J Nanobiotechnol 22, 524 (2024). https://doi.org/10.1186/s12951-024-02807-8
Received:
Accepted:
Published:
DOI: https://doi.org/10.1186/s12951-024-02807-8
